
Moving Beyond Aggregate Metrics in Program Evaluation
July, 2026
This article is rated as:

As evaluators, we often summarize program outcomes using aggregate metrics, such as averages, overall change scores, and group-level percentages. These are efficient, easy to explain, and, often, expected of funders and decision-makers.
The problem is that averages can hide important variation. For example, when most participants in a program show little change and a smaller group improves significantly, the average barely shifts – even though something meaningful happened to a subset of participants. A program that made a real difference for some participants can appear to have a low impact in a summary table, which can mask insights about who benefits the most and why.
This misrepresentation has real consequences:
Programs get labelled as ineffective;
Resources get misallocated; and
Findings that matter most for learning and improvement get overlooked.
This article outlines when aggregate metrics are likely to be misleading, how to surface the findings that averages can hide, and how to communicate these findings without compromising rigour or confidentiality.
Why We Default to Averages
Averages are easy to produce, easy to explain, and often expected. When a program director asks, “Did the program work?”, a single number can feel like a clear answer. But evaluation rarely happens under controlled conditions. It happens in the real world, where programs are implemented in complex settings, participants enter with different needs and starting points, and outcomes unfold in uneven ways over time.
In this context, a single number rarely captures the nuance needed for a rigorous, comprehensive evaluation. Averages can be useful when participants are relatively similar, program delivery is consistent, and the evaluation question is truly about the group as a whole. But real-world programs are rarely that tidy. Participants engage to different degrees, experience different barriers and supports, and may benefit in very different ways. When those differences matter, collapsing everything into one number can flatten the very patterns an evaluation is meant to understand.
The average tells you what the typical participant experienced. It tells you very little about whether the program worked for the people who needed it most.
When to Question Your Aggregate Results
Not every evaluation requires a deeper look into aggregate results. But certain situations suggest that averages may be hiding something important. If one or more of the following apply to your evaluation, it is worth looking beyond the summary statistics.
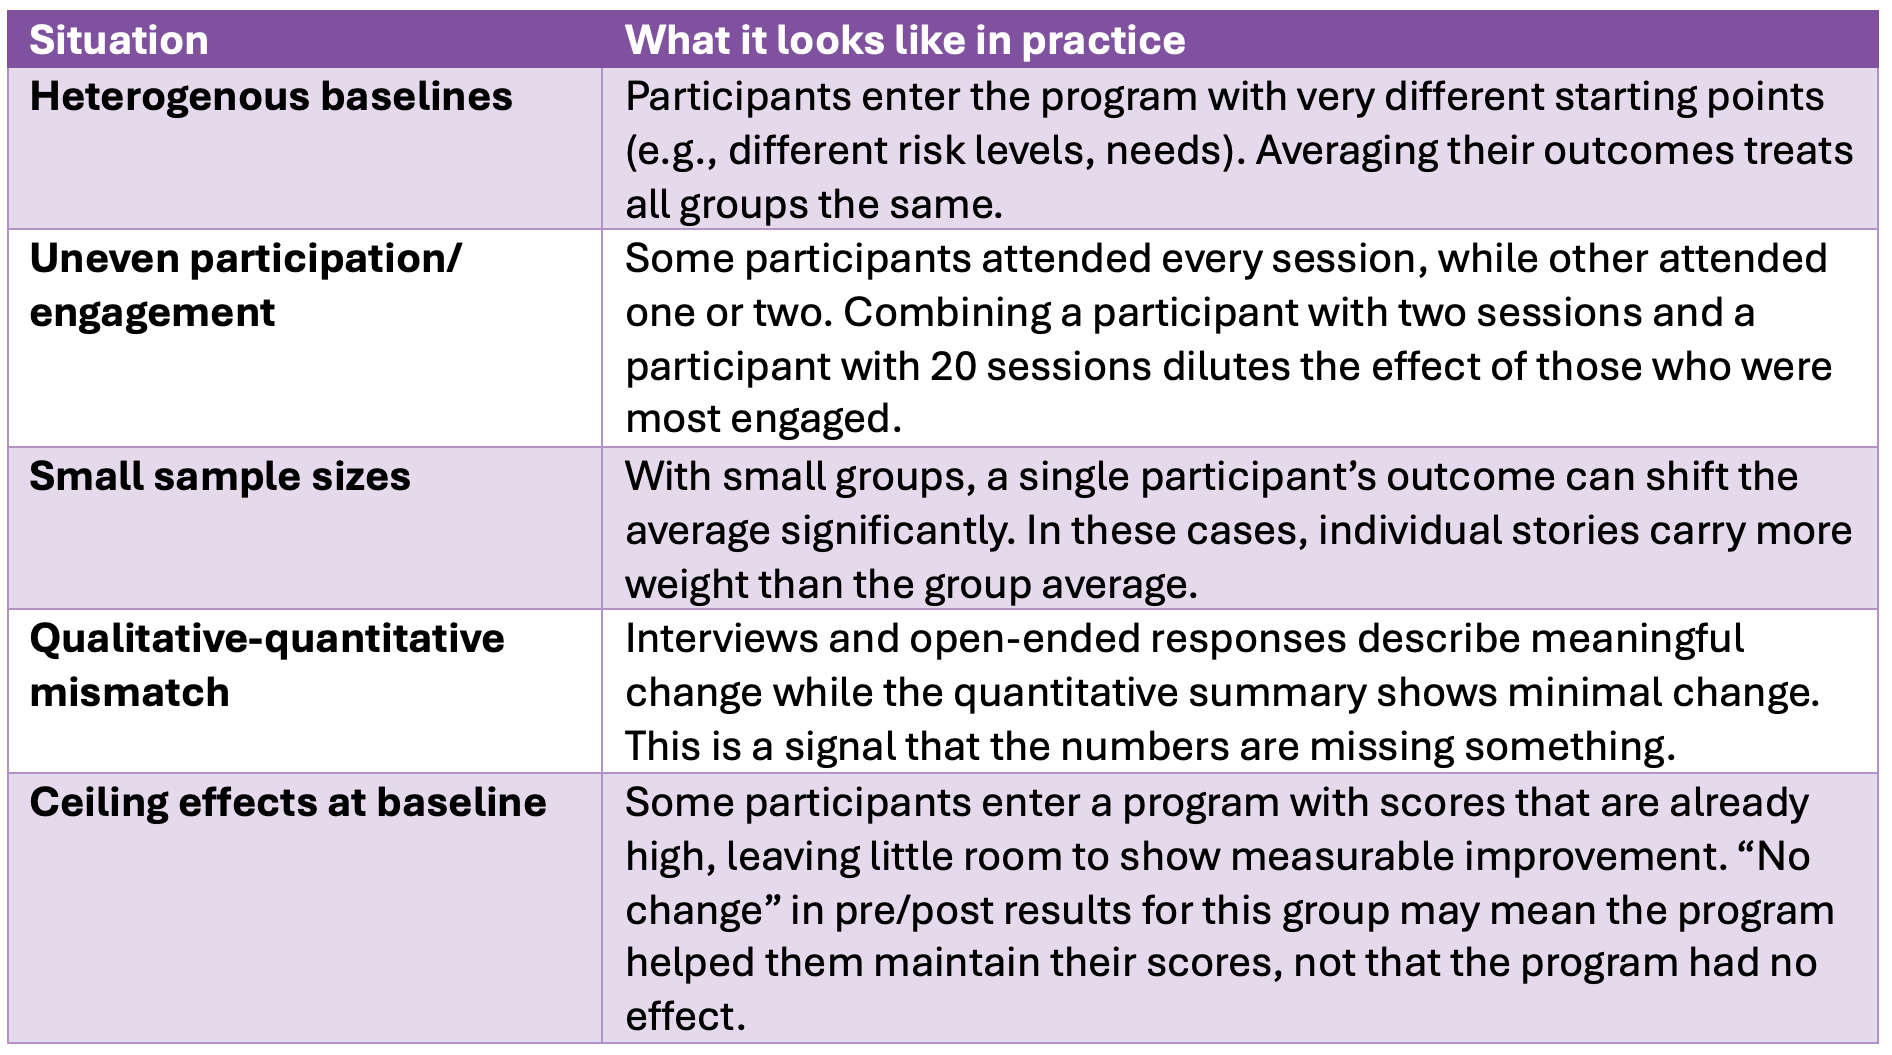
If any of these situations are present, treat your aggregate results as the starting point of the analysis, not the conclusion.
Surfacing Hidden Findings
The following four strategies are designed to complement aggregate reporting, not replace it. Used together, they give a more complete and more accurate picture of program outcomes.
Strategy #1: Assess Distributions, Not Just Averages
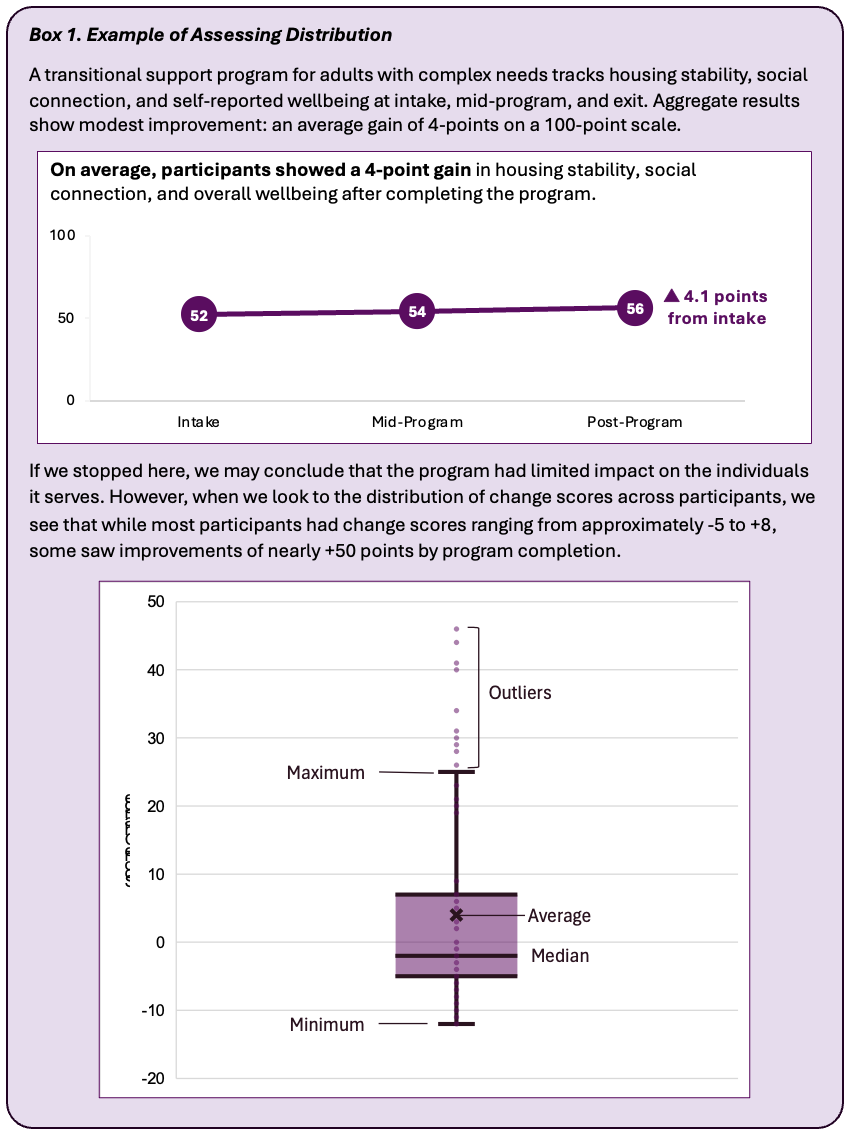
Instead of reporting only average change scores, show the spread of outcomes. A histogram, dot plot, or a simple summary of the range and distribution makes variation visible. Name the outliers, both positive and negative, rather than removing or ignoring them. Outliers are a part of the story and can indicate when there is room for further analysis beyond the aggregate.
To better illustrate these strategies, consider the following hypothetical example:
Strategy #2: Segmentation
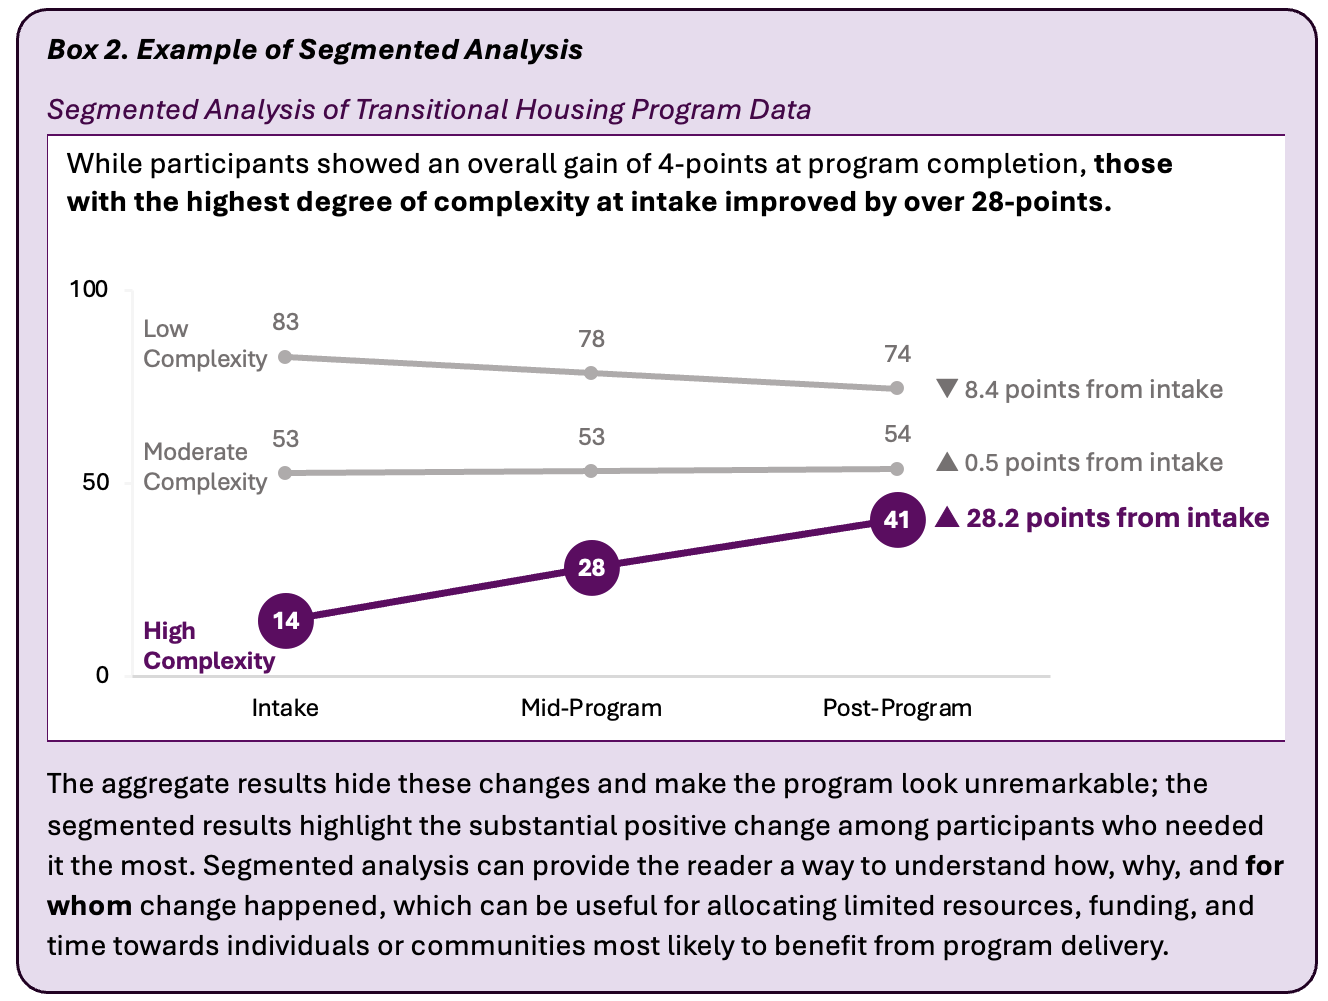
Once we have assessed the distribution of the data and determined there is room for further analysis, one strategy for looking beyond the aggregate is segmented analysis, which involves grouping participants by meaningful characteristics (e.g., risk level, program engagement, relevant demographics) and examining outcomes within each group. This helps answer: “Did the program improve outcomes for those who needed it most?” Segmentation can also help identify the conditions under which the program works best. A program with modest overall effects may show strong effects within a specific subgroup. This is a valuable finding for program improvement and resource allocation.
Strategy #3: Individual-Level Change
Look at each participant's trajectory from intake to exit rather than focusing only on group averages. Pre/post comparisons for individual participants can reveal who improved, who remained stable, and who declined. When presenting individual trajectories, include the full range of outcomes. The goal is an accurate picture, not a positive one.
Using Analytic Case Studies to Assess Individual-Level Change
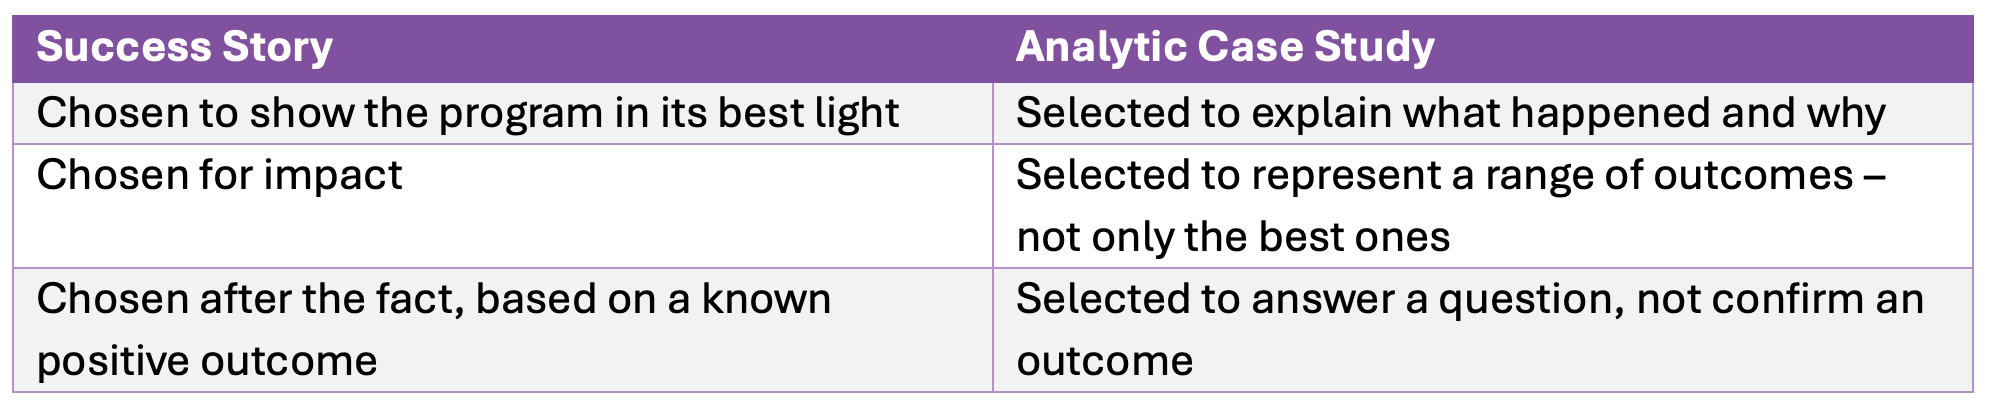
Case studies and success stories are not the same thing. Success stories are selected to highlight positive outcomes – they highlight outcomes rather than explain them. Analytic case studies are selected to explain what happened, for whom, and why. That distinction matters because we are not trying to tell the best version of the story, we are trying to understand the story.
Consider the following example, using the same hypothetical program data described earlier:
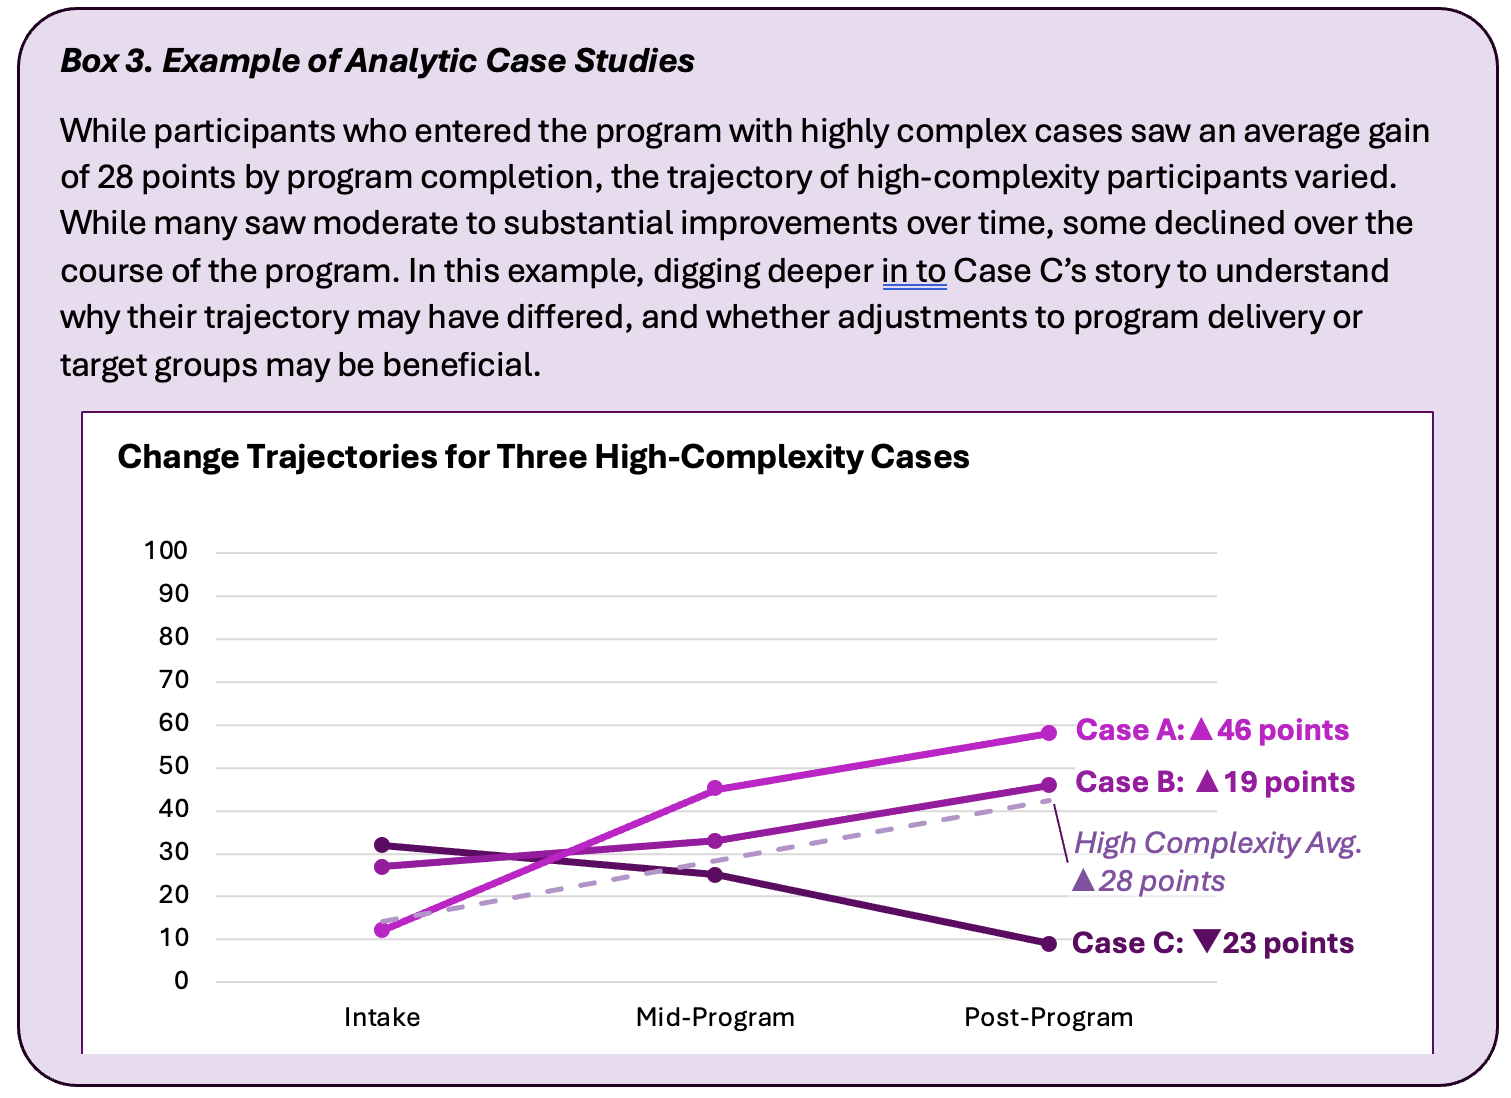
A well-designed analytic case helps show how a program affected participants as individuals, not just as part of an average. Even in cases where most participants remain stable, substantial changes among some individuals can help us understand who benefited, how that change happened, and under what conditions the change occurred.
By comparing individuals to themselves over time rather than to a group average, analytic case studies can help illustrate program nuance through anonymized participant stories. This information can be invaluable for understanding where the program is making a difference and how it can be improved or better targeted.
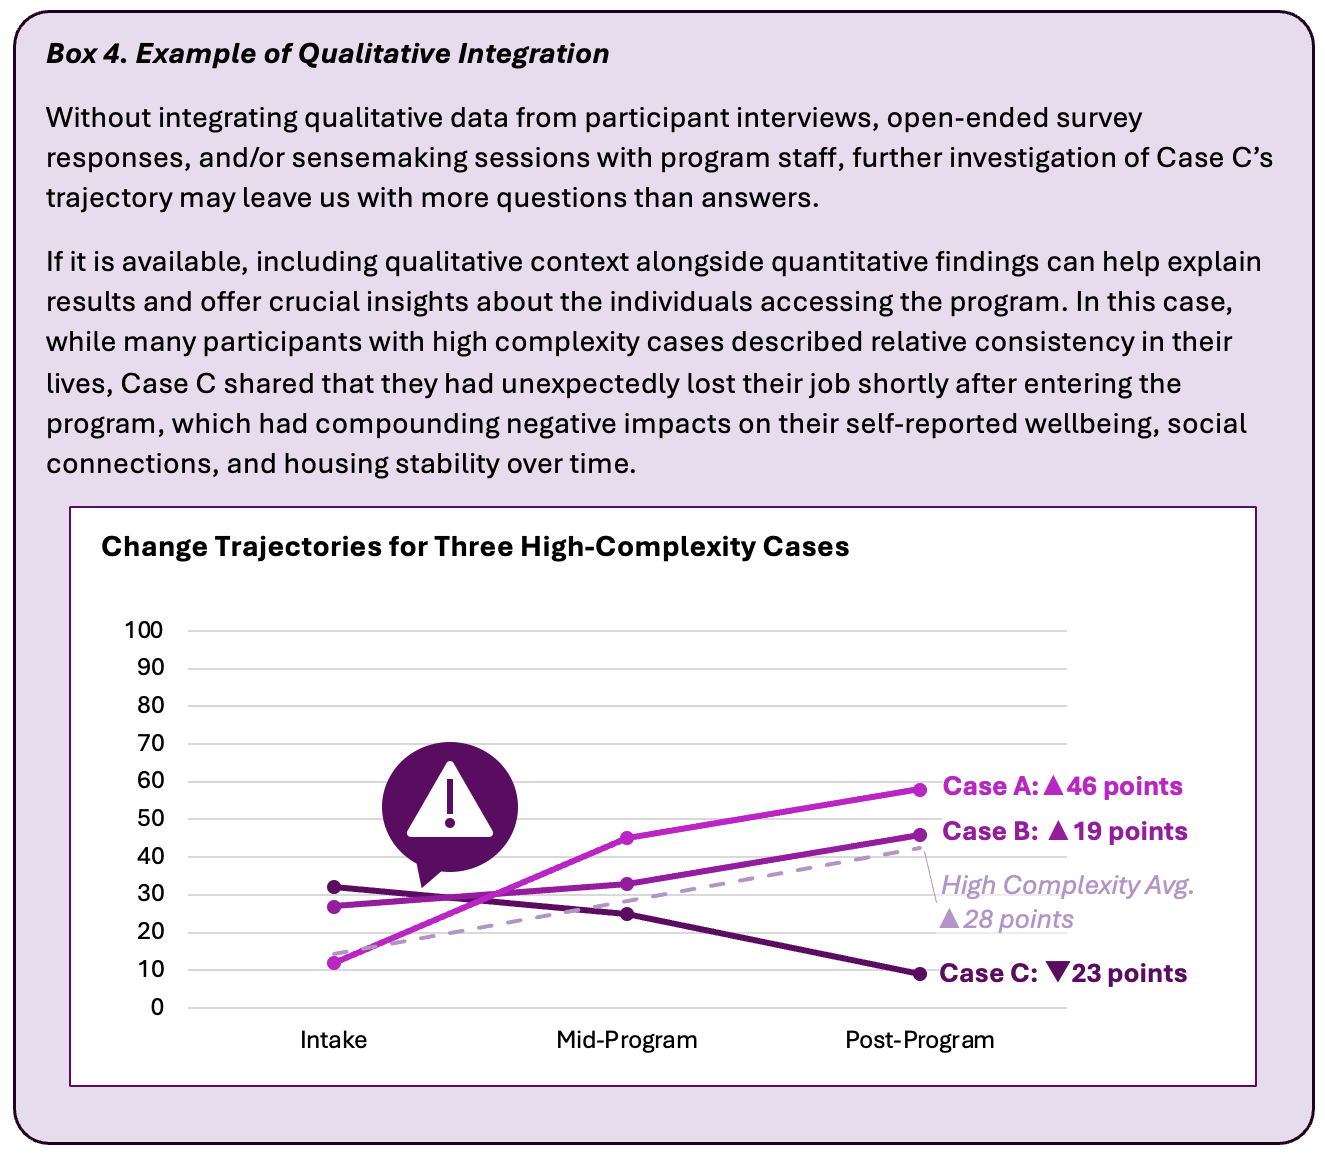
Strategy #4: Integrate Qualitative Insights and Program Context
When quantitative results look modest, qualitative data often provides the explanation. Interviews, open-ended responses, and sensemaking sessions (aka data parties) with program staff can surface outcomes that numeric measures missed and add context that makes numbers meaningful. Use qualitative data to explain and contextualize your quantitative findings, particularly when the numbers and participant feedback are telling different stories.
Communicating Results Responsibly
Individual-level findings in summative reports raise two legitimate concerns. The first is ethical: identifying participants through specific case details is a breach of confidentiality and/or consent. The second is methodological: drawing broad conclusions from a single case is an error.
These are risks to manage – not reasons to avoid individual-level findings altogether. The following strategies help present these findings responsibly.
Before all else, consider whether the insight is worth the risk. Not every difference needs to or should be reported. Segmenting results or presenting analytic case studies can improve understanding of who benefits from programs and why, but it can also expose participants to harm through risk of identification, stigma, or misuse of findings. This is especially important when disaggregating by systemically marginalized demographic characteristics. Report these findings only when they are necessary, easily understood by potential readers, and can be presented in a way that protects confidentiality and situates findings within broader structural inequities.
Lead with aggregate results, then add context. Present the overall summary first and then introduce the individual-level findings (see Bias #5). For example: “On average, participants showed modest improvement. Among those who entered with the highest complexity, outcomes were notably stronger.”
Use composite cases. A case study does not need to reflect a single person. A composite case draws on several participants’ experiences to illustrate a pattern. This protects confidentiality while preserving the value of the finding. This approach is especially useful when sample sizes are small.
Use pattern-focused descriptions. Describe the trajectory rather than the individual. “A participant who entered with multiple barriers and low scores across all measures showed steady improvement throughout the program,” communicates a meaningful outcome without identifying anyone.
Mask specific details when samples are small. Use relative terms instead of exact counts or identifying descriptors. For example, "a small number of participants" instead of "two out of three participants," or "most participants" instead of "11 out of 12 participants."
A report that avoids individual-level findings is not more rigorous – it is less complete. Present what the data show and protect participants in how you present the results.
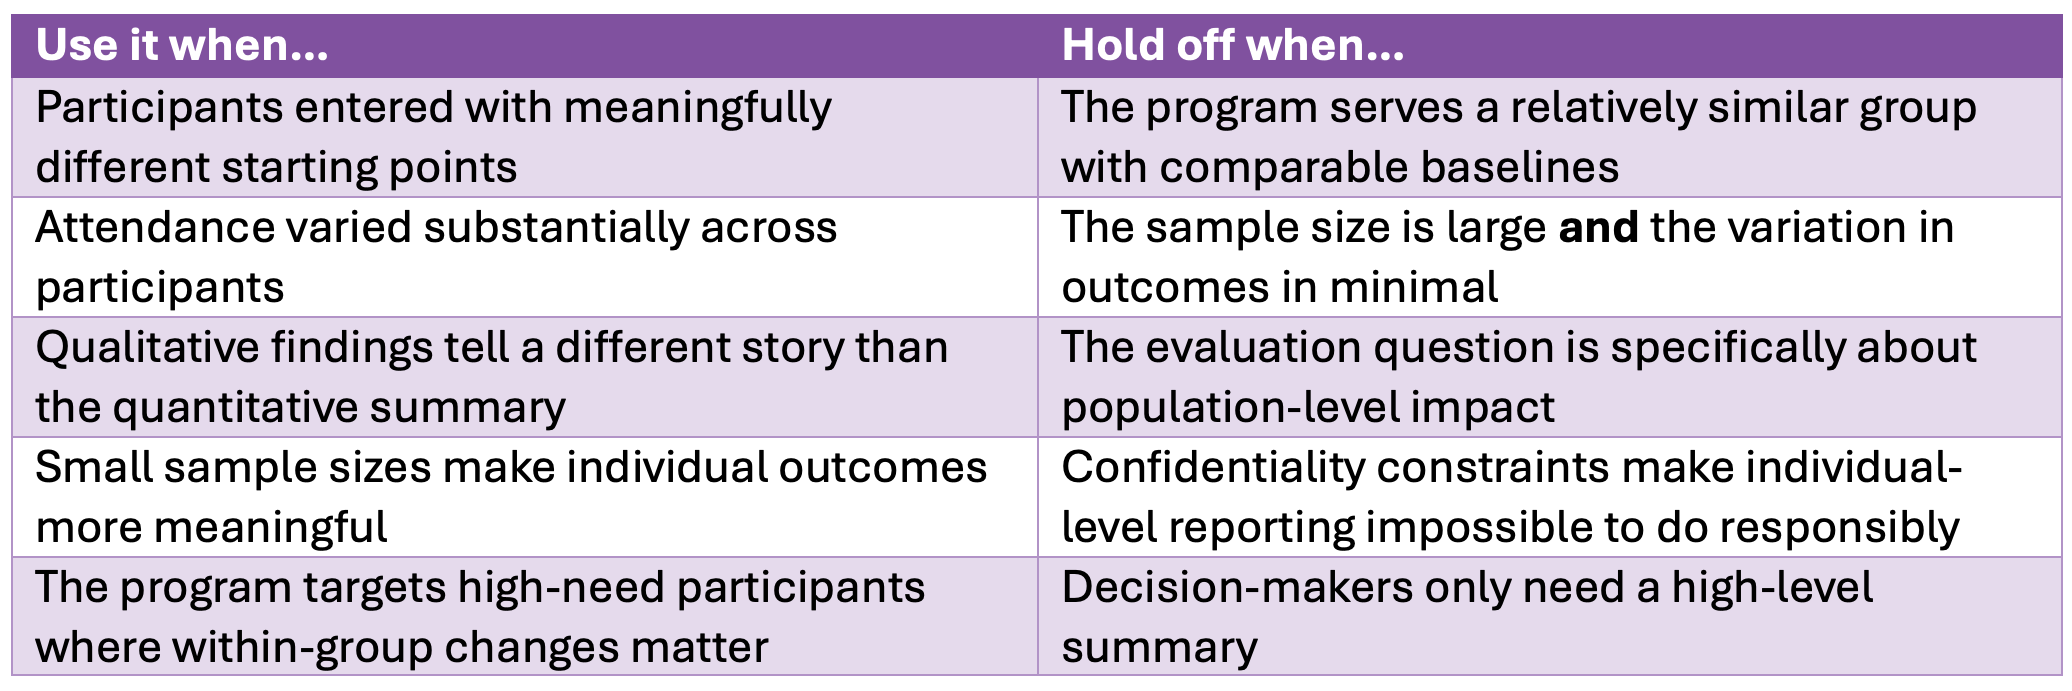
When to Use These Methods
These approaches are not necessary for every evaluation. Aggregate reporting is appropriate in many contexts. The table below summarizes when it makes sense to look deeper and when it does not.
Before You Report
Aggregate reporting is an important part of evaluations, but it is not the whole picture. When a program services participants with meaningfully different starting points, when engagement levels vary, or when qualitative data tells a different story than the numbers, it is worth looking deeper.
The strategies in this article – individual-level analysis, segmentation, distribution reporting, and qualitative integration – give you practical ways to surface findings that aggregate results can hide, without replacing those results or compromising participant confidentiality.
When results show little overall change, resist the conclusion that nothing happened. Ask first whether the average is the right tool to answer the question.