
The Data Cleaning Toolbox
November 2021
This article is rated as:


The end goal of collecting data is to eventually draw meaningful insights from said data. However, the transition from raw data to meaningful insights is not always a linear path. Real-world data are messy. Often, data will be incomplete, inconsistent, or invalid. Therefore, it is imperative that data be cleaned to correct for these errors, or “realities,” prior to analysis. Otherwise, analyzing messy data will result in incorrect interpretations and unnecessary headaches.
This guide is designed with real-world data in mind. Data are prone to human-error and this guide will help you correct those errors, as well as provide tips on how to minimize these errors in the future. Why is this important? Because data cleaning is time consuming. It is not uncommon to spend 50+% of your analysis time on data cleaning and preparation.
By reducing the amount of time required to clean data, through the methods outlined in this guide, your time can be better spent on analysis and drawing insight from the data.
Identify the Problem
Before data cleaning, it is critical to identify problems within the data set. Sometimes these issues are apparent, such as wonky date formats or missing data. Other times, these issues are more obscure and hidden. This is often the case with open text responses which often include slight spelling errors or extra spaces.
A quick and dirty method to identify some of these issues quickly is to insert the data into an Excel data table [Insert > Table > Select Data Range]. The data table envelopes the full data set and automatically adds filters to each column of data (Note: ensure that you have selected the correct column headings). Now within the data table you can simply click the filter arrow, which provides a full list of all unique values.

Numerical data are not immune to data entry issues either. However, these issues usually result in nonsensical results (e.g., a value of 8 for a question with a scale from 1 to 5) or outliers. It is possible to use the data table approach above to find incorrect numerical data entries too. This can be efficient for Likert scale questions coded as numbers. However, this approach can be laborious when data span larger ranges (e.g., height and weight data). For these data, a quick scatterplot can be used to visualize the data.

With data issues identified, you can begin cleaning the data. The following sections of this guide will address common data issues and how to clean them using Excel.
Common Data Issues
The following section identifies several common issues with data quality. Each issue will be discussed separately with tips on how to identify these issues and, importantly, how to address these issues.
The data issues that will be addressed include:
Missing data
Date data
Inconsistent data
Invalid data
Duplicate data
Missing data
Missing data may be negligible in some instances but have the potential to cause serious issues during the analysis phase. Negligible instances include a few blanks (i.e., literal blank cells) that are not calculated in summary statistics, such as sums and averages. These missing values usually have a minor, if any, impact on analysis. Blank cells are unlikely to cause significant problems. If, however, you have used placeholders (e.g., 0 or 99 are common), these placeholders can mistakenly be used in analysis and significantly change the results.
In the table below, each column has identical data. The only difference is how missing data are treated: blanks, NA, 0 and 99. At first glance, all looks fine. When we begin to analyze the data, we see issues emerge. The subsequent table summarizes each column without accounting for missing data values/codes. We can see there is variation between most approaches.

We can clearly see that numerical placeholders can cause issues in calculating summary statistics. Both NA and blanks resulted in the correct result in this example. However, leaving cells blank may lead to a few questions. Are the cells blank because data are missing? Or are cells blank because of an error in the data entry process?
The best approach for handling missing data is to communicate effective data entry protocols with all data entry personnel. However, this is not always possible before receiving the data. Therefore, you can use the following method to correct your missing data entries.
Method 1: Find & Replace
‘Find & Replace’ can be used to quickly standardize missing values within a spreadsheet. For example, if 99 is used to denote missing data, simply highlight the full spreadsheet, and do a ‘Find & Replace’ (CTRL + H). Simply ‘Find’ the 99 values within the selected range and ‘Replace’ with NA.

Tips for handling missing data
Use “Blanks” or NA as the default cell value for missing data. There are a few options when working with missing data. We suggest that missing values be left “Blank” or that NA be used as a placeholder. The reason we suggest two options is that analysis, especially analysis external to Excel, requires different handling of missing values. For example, R statistical software requires missing values to be coded as NA. But for SPSS, numerical fields cannot have text values. Understand the requirements of any statistical software you may be using outside of Excel, and select the most appropriate option. However, within Excel, using “Blanks” or NA work well in most situations.
Avoid using numerical placeholders where possible. If you have agreed on using a numerical placeholder, the analyst, and anyone working with the data, should be made aware of the fact. The placeholder should also make sense. For example, if you have an age variable, using 99 as a placeholder could cause problems as 99 could be a valid age. In this instance, using a different placeholder would be necessary.
Be consistent. Regardless of how the data are entered, a single, agreed upon format should be the default. If communicated properly, any code value could be used to denote missing data.
Date data
Date formatting can cause major headaches when working with data. Dates can be coded in myriad formats. Further, within Excel, it is not uncommon to have dates formatted as text or numbers. When this is the case, any attempt at sorting the data by date or subsetting by date range becomes infinitely more difficult.
In our work, it is common to receive data where dates have been coded in two or more formats. The more formats, the more difficult the data cleaning process becomes. With small datasets, manually fixing date formatting is an option. However, as the data set becomes larger, this option becomes less desirable. Re-entering hundreds of dates manually is both time consuming and prone to human error.
Shown below, text date formats can be disguised within the data set. These may be difficult to detect when data are extensive. Therefore, there are a few steps that should be taken immediately when dealing with date data.

Highlight the date column and right-click the highlighted area. Select ‘Format Cells…’ and convert all cells to a consistent date format.
Tip: Select a different format than that currently displayed. If all cells change to the new format, your dates are all in the date format and you can move forward with your analysis.
Convert your data to a data table if you have not done so already. Click the arrow within the date heading to view all dates. If the data are all dates, they will be aggregated into Year and Month sub-categories. Text will display separately.
Following the previous two steps should help you identify if there are any issues in date formatting within your data set. If you find issues, it is time to fix these date inconsistencies. This task can be approached in a few different ways. As mentioned already, with small datasets, manually fixing dates can be used. However, this is rarely feasible, and the following methods will be more pertinent to most real-world data.
Method 1: VALUE function
The VALUE function converts text from a recognized format (e.g., a number or date) into a numeric value. This approach is both fast and effective in dealing with dates that are entered as text. However, text needs to be spelled correctly for the VALUE function to work properly.

Method 2: Find & Replace
Sometimes a simple ‘Find & Replace’ is all that is required to clean date data. This is most effective when dates have a similar structure, but have inconsistencies in the delimiter between month, day, or year values. Simply highlight the column with date data and do a ‘Find & Replace’ (CTRL + H). For example, a period may have been used instead of a comma. ‘Find’ the ‘.’ within the date range and ‘Replace’ with ‘,’.
Tips for handling date data
Be consistent. Regardless of the date format, convert all dates to the same format.
Convert text string data to a date serial number if possible. Text data will cause issues when sorting dates and will error out any formulae using dates.
Communicate to date entry personnel on an agreed upon format for all dates.
Inconsistent data
Inconsistencies in data often result from open text responses. This is where punctuation and spelling play an important role in data entry and analysis. Excel is often quite good at identifying the same word with differing punctuation (e.g., Female, female, FEMALE). However, this is not the case with external statistical software like R. Further, misspellings and differing nomenclature can result in even more issues (e.g., F, Fem, woman).
Inconsistent data can be addressed using one or more of the following methods. For more variable or complex text entries, other software (e.g., OpenRefine) can be leveraged for cleaning the data.
Method 1: PROPER. UPPER, and LOWER Functions
Using the PROPER, UPPER, or LOWER functions can help correct text data that vary in their capitalization or lack thereof. The PROPER function capitalizes the first letter of each word, while UPPER and LOWER functions convert all letters to upper care or lower case, respectively. To use these functions, simply enter the formulae as: “=PROPER(reference cell)”. Replace PROPER with UPPER or LOWER if needed. The reference cell is the cell that you want to correct (the reference cell is B2 for all of Row 2, B3 for all of Row 3, etc.).

Method 2: Find & Replace
Sometimes words are misspelled or entered in a format that does not align with the other data entries. Depending on the amount of variation within the data, a simple ‘Find & Replace’ could work.

Method 3: Sort, Filter, and Correct
While the first two methods will work for most cases, sometimes it is more feasible to go with manual edits. With data in a table format, you can sort the data alphabetically and filter by specific values; this will allow you to target inconsistencies in the data. With the data sorted and filtered, you can easily make manual edits to the inconsistent data entries. Just ensure that if you are making manual edits, that the new entries are accurate.
Note, that with manual edits, there is still an increased probability of human error. The more “human” manipulation of data, the more likely an error could occur that you cannot easily catch (e.g., accidentally copying and pasting “female” over “male” by selecting one too many cells). If possible, limit the amount of manual editing within your Excel worksheets.
Tips for handling inconsistent data
Be consistent. Convert all entries into a single, pre-determined format and be consistent throughout the spreadsheet.
Be careful when using data tables. Data tables do not highlight differences between the different spellings of a word. Excel may handle differences in capitalization well, but external statistical software does not. Convert everything to the same format to improve data quality across all software and platforms.
Communicate data entry requirements to all personnel. Consistently entered data is markedly easier to work with.
Invalid data
Invalid data usually stem from one of two causes: (1) incorrect data entry, or (2) errors in Excel functions. Unless familiar with the acceptable range of values for a given variable or question, invalid data can go undetected. For example, a questionnaire may ask respondents to rank their satisfaction on a scale of 1 and 5. In this case, a value of 0 or 6 would be invalid. However, without prior knowledge and context, these values may go undetected and results from subsequent analyses will be inaccurate.
In the above example, the issue is the result of data entry error. This issue can be addressed in a few different ways depending on if the error is consistent or not.
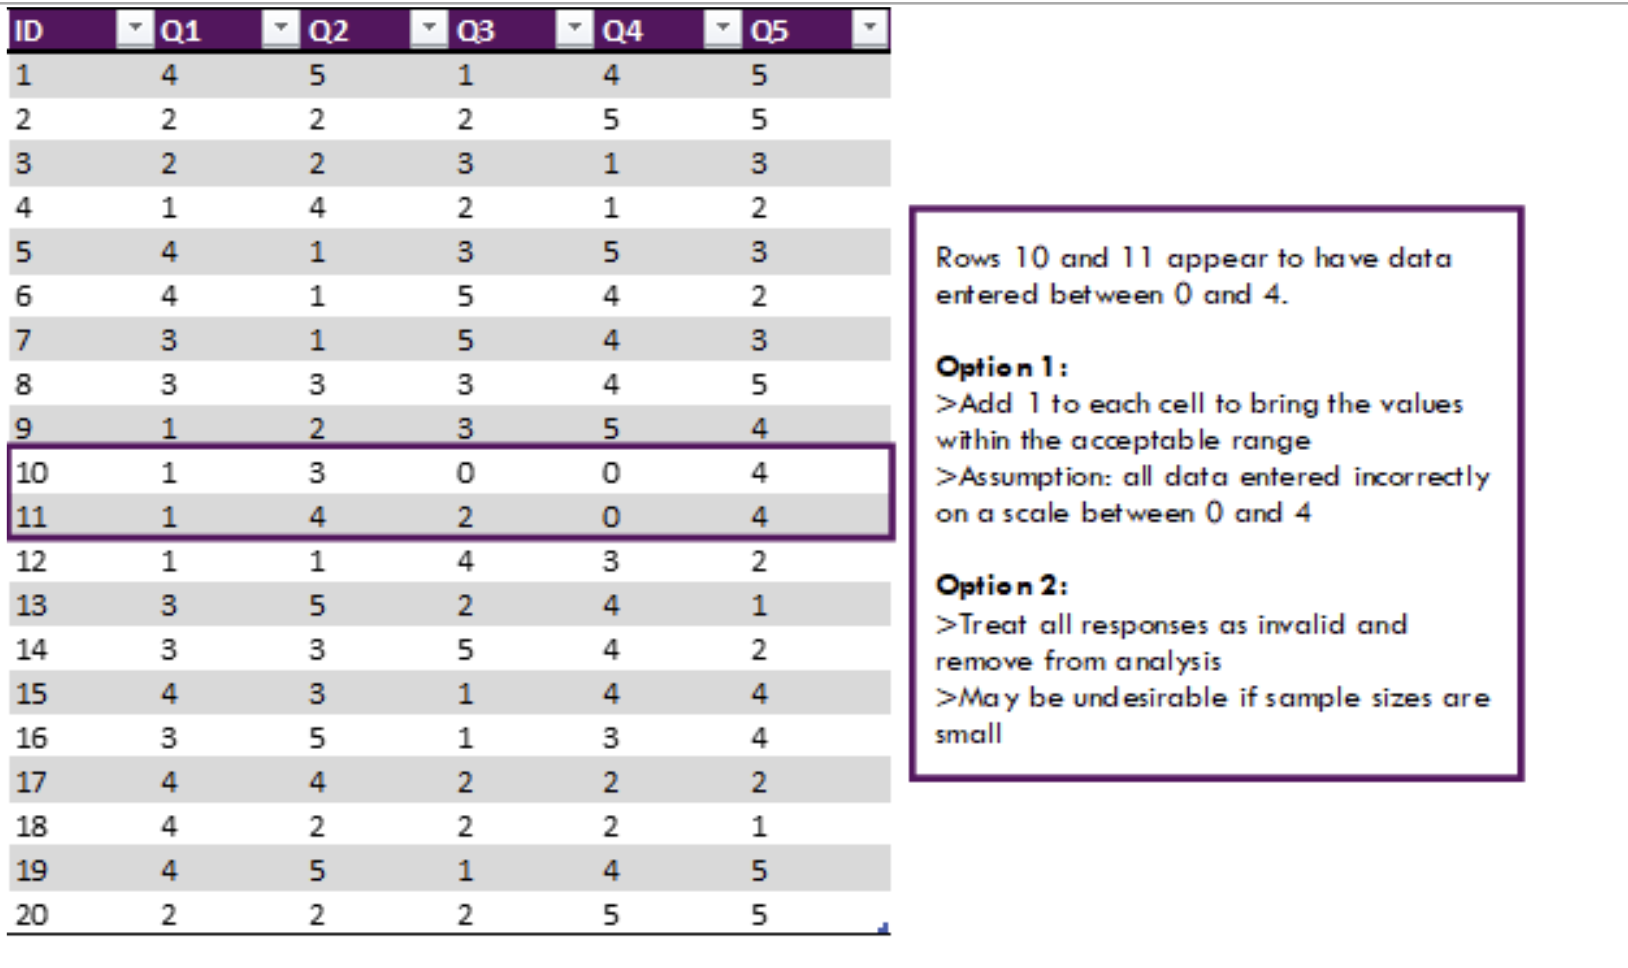
Errors may be more extreme than the previous example and fall completely outside the acceptable range. For these data, different approaches will need to be implemented to best address the underlying issue. Consistent errors bring into question the validity of the entire data set, while one or two errors can be chalked up to human error.
Method 1: Check Data Ranges
For numerical data, it is easy to check the range of a given data set. Simply highlight the column of the desired variable and a few summary statistics will be provided in the bottom right corner of the Excel worksheet (Note: you may need to right click and customize the status bar). Valuable statistics include the average, minimum value, and maximum value. You can immediately detect abnormalities in the data if the data values are outside the expected range.

Dealing with invalid data often results in assumptions and judgement calls needing to be made. This becomes increasingly difficult with data with numerous invalid data. The following flow chart provides questions that should be asked when evaluating data. When invalid data are encountered, work through the steps and make corrections as needed.

Tips for handling invalid data
Apply a function to bring data into the expected range if appropriate. This assumes data were entered incorrectly on a consistent basis.
Remove invalid data if the invalid responses are few and random.
Question the data validity if invalid data are extensive. Communicate with data entry personnel to determine if there were errors made during data entry.
Duplicate data
Duplicate data result from repeated values. These duplications may result from multiple data pulls of a given database, double entries during the data entry process, or duplicate data submissions. It is important to identify duplicates prior to analysis. Duplicate values, when left unchecked, can skew the results of analysis by inflating data counts and influencing averages and other statistical measures.
The end goal of this section is to eliminate all identical records except for one. In Excel, this process is relatively straightforward.
Method 1: Remove Duplicates
To remove duplicate values, first highlight the range of cells from which you want to remove the duplicates. In the ribbon above the spreadsheet select Data and Remove Duplicates. The Remove Duplicates menu will appear (shown below), and you can select the columns from which you want to remove duplicates.

Tips for handling duplicate data
Identify if the data is at risk of having duplicates. Were the same data pulled multiple times? Have several people worked on the data entry process?
If in doubt, run a quick Remove Duplicates check to determine if there are duplicates in the data. You may want to test this before cleaning the data fully. In the process of the data cleaning process, you may inadvertently code values differently resulting in non-duplicates where there could potentially be a duplicate.
This guide outlines common real-world data issues and approaches for handling these data issues. While I outline the process for dealing with these data issues, it is more time effective to deal with these issues during the data collection phase. Consistency in data entry is crucial for accurate analysis of the data. To move toward consistency, open communication with data entry personnel is key.
Despite best efforts, data will rarely be in a fully clean state. Most errors tend to arise from human error - going slow and checking data consistency and accuracy along the way will drastically reduce headaches down the road. Hopefully this guide will ease the process of getting raw data into a usable state.