
What’s The Difference: Bias Versus Confounding?
April 2023
This article is rated as:

In every research and evaluation project, it is important to identify and address sources of error that may impact the accuracy of your findings and the relevance of your recommendations.
Two common sources of error in evaluation are bias and confounding.
Here, we will look at what bias and confounding are (and are not), the differences between them, and important considerations to take to prepare for and address both in your next evaluation project.
What is bias?
In research and evaluation, bias refers to systematic error in the way data are collected, analyzed, or presented resulting in incorrect interpretation of the findings.
There are many types of bias that can occur in evaluation which fall into two broad categories: selection and information biases.
Selection bias
Selection bias refers to systematic differences between those who engage in a program and those who do not, or when only certain groups are given the opportunity to give their opinion. Specific types of selection bias include:
Sampling bias results when groups of individuals are over- or under-represented during the data collection process.
Allocation bias refers to scenarios when researchers or evaluators don’t appropriately randomize participants to experimental and control study groups.
Attrition bias refers to systematic differences between participants who stay in a program and those who leave the program.
Information bias
On the other hand, information bias refers to systematic differences in the way data are collected from participants. For instance, if an evaluator sits in on a particular session to assess how an intervention is being delivered, facilitators and participants may alter their behaviour to ‘impress’ the evaluator without even realizing they are doing it. This is an example of one type of information bias called Observer Bias. Other types of information bias include:
Interviewer bias which occurs when an interviewer has preconceived ideas about the person they are interviewing which clouds or distorts their perception of the interviewee’s responses.
Recall bias occurs when participants do not accurately remember an experience and leave out or alter details when reporting about it.
Non-Response bias is the skewing of results due to differences between respondents who answer specific questions and those who skip questions.
Social Desirability bias refers to the tendency of participants to answer questions in a way that makes them or their actions seem more appropriate or desirable to the person asking the questions.
What is Confounding?
Confounding refers to situations where there is a real relationship between a program or intervention and the outcome you are measuring, but it is affected by the presence of another factor called the confounder.
A straightforward way to think about this is to think of the synonym of confound, which is ‘confuse’. In other words, confounding variables confuse your findings.
Example 1
A classic and simple example of confounding is the relationship between increased ice cream sales and decreased rates of the common cold.While it might appear that ice cream is protective against contracting the common cold, what really explains this association is the confounding variable of the weather.
Warmer weather is related to higher ice cream sales and lower common cold rates even though ice cream sales and common colds aren’t directly related to one another.
In this case, the weather confounds the association between ice cream sales and rates of the common cold.
Example 2
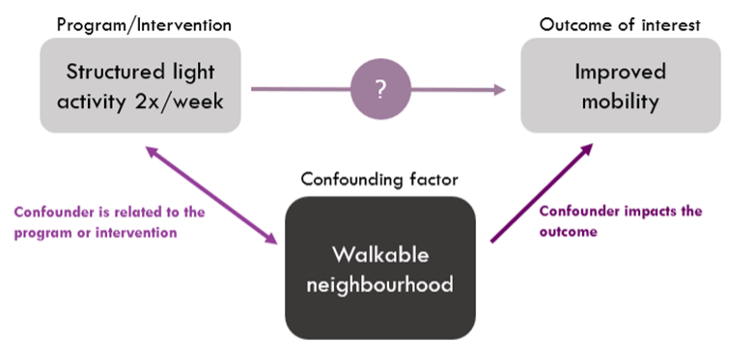
To understand confounding in the context of program evaluation, consider evaluating the impact of a new light activity program to increase mobility in older adults.Although it is possible that the program is successful in improving mobility on its own, it is also possible that adults who live within walking distance of a favourite café may be more motivated to attend the program so they can maintain their mobility and continue walking to the café.
If their regular walks to the café (which occur outside of the structured activity sessions) also play a role in improving their mobility, the walkability of their neighbourhood may be confounding the association between the activity program and improvements in mobility.
When confounding isn’t addressed, there are four primary ways that it can impact our results. The presence of a confounding variable may result in:
A spurious association: An apparent association despite no real association.
A hidden association: An apparent absence of association despite a real association existing.
Positive confounding: Enhancing (or overestimating) a true association.
Negative confounding: Masking (or underestimating) of a true association.
What is the difference between bias and confounding?
In short, bias refers to systematic error in how we measure or report data, while confounding refers to real but misleading associations.
The ability to distinguish between biasing and confounding factors can be helpful in evaluating the true impact of a program or public health initiative on the desired outcome.
While neighbourhood walkability is a possible confounding variable in the example above, if only adults who live in walkable neighbourhoods were included in the light activity program, then this would be an example of sampling bias rather than confounding. What is important to note here is that you can often account for confounding, but not bias, in the way you analyze and report your findings.
For instance, to account for how confounding may impact your results, you could compare the improvements in mobility between the ‘walkable neighbourhood’ and ‘non-walkable neighbourhood’ participants. This would allow you to estimate how much of an effect the activity program had compared to the impact of neighbourhood walkability on mobility. However, if your sample were biased to include only participants from walkable neighbourhoods, you would not be able to examine how living in a walkable area may affect mobility. In this case, you would need to report this bias and how it potentially skewed your results.
How can I predict and avoid bias and confounding in my next research or evaluation project?
I have found that the key step is to continually remind yourself and your team that the issue you are investigating is almost always part of a larger, more complex system than what your project can assess.
Throughout a project's lifespan, there are practices that can help you and your team predict, identify, and overcome sources of bias and confounding to unveil accurate and actionable results.
Duringproject development and outcome operationalization
In these phases, ensure you are specific and clear in your definitions of variables and aims. For instance, if you aim to measure how a certain intervention impacts participants' health, be clear about what health means for your evaluation.
It can also be useful to collect information about an outcome of interest in a few different ways (for example, through surveys and participant interviews) to reduce the chance that you are missing areas of bias or confounding.
For an evaluation within the healthcare field, some questions to consider when developing your measures could include:
What type of health outcome are you assessing? Are you looking at overall wellbeing, or something more specific such as blood glucose levels or scores on an anxiety screening test?
How will you measure the type of health you are interested in assessing? The way that we collect information about someone’s health can greatly impact the results of an analysis. Using objective measures that have been validated through repeated trials will increase the accuracy of your evaluation and allow you to compare the results to other similar programs.
Are there meaningful thresholds that indicate distinct levels of this type of health? Depending on the type of health outcome you are assessing and the measures you are using to assess it, small improvements in measures could be meaningful or arbitrary. It is best to select a threshold that is supported by existing literature before you begin your project to avoid biasing your results.
What are some possible unintended findings of this evaluation? It is always a good idea to discuss possible findings with your team and stakeholders. Sometimes, even after thorough discussion, we find that our results tell us something completely unexpected! Be open to these findings and plan for how you will present them in your report to stakeholders or clients.
During data analysis
Although more common in research, depending on the size and scope of your evaluation you may be able to ‘control’ for confounding variables through statistical modelling. ‘Controlling’ a variable means holding it constant while assessing the changes in the variable(s) of interest. The method you use to control your confounding variable(s) will depend on your analytic method, but in the right settings, it can allow you to look specifically at the independent impact of the program or intervention on your outcome of interest.
After analysis
It is also important to not just take the data at face value but to ask why an association may exist. Consider what other factors, including ones that you did not or could not measure, may have played a role in the observed outcome. For instance, was one group more likely to meaningfully engage in an intervention compared to another group? Is the sample who is accessing your program more likely to face hardships not addressed by your program that may impede their progress toward the target outcome? Talking through preliminary results with your team, stakeholders, and/or clients may help to explore hidden confounding or uncover biases that would otherwise go unnoticed.
When reporting your findings
At this stage, it is always important to note the limitations of what you can conclude from the data collected. Often single sources of information are not enough to give us answers that span across diverse groups and populations, and that is okay! By reporting information about the demographic groups of participants, the program methods, and how outcomes were measured, you can more accurately draw conclusions from your findings without overgeneralizing the results.
Associations in programs and studies involving humans are often complex and involve more factors than we can assess in any single research or evaluation project.
Understanding how to identify sources of bias and confounding can help you and your team to draw more well-informed conclusions from your analyses and provide realistic and actionable recommendations for future projects.