
Normal distribution
The normal distribution (a.k.a. bell curve, Gaussian distribution) is one of the most important concepts in statistics. The point of the normal distribution is to say that, for whatever we’re measuring, most people will be close to the mean value, and fewer people will have exceptionally high or low values.
For example, if you measured how long pizza deliveries take to get to your house, most of the time it would be around the mean (30 minutes). Sometimes it would be a little bit faster or a little bit slower depending on traffic, so it might take 25 or 35 minutes. In rare cases, there would be really long or really fast delivery times. Maybe once or twice the driver speeds and gets it there in 15 minutes, and one time the car breaks down and it takes them 45 minutes. This is reflected in the graph below: delivery times that are more common are higher in frequency, while uncommon delivery times (toward 15 and 45 minutes) are low in frequency.
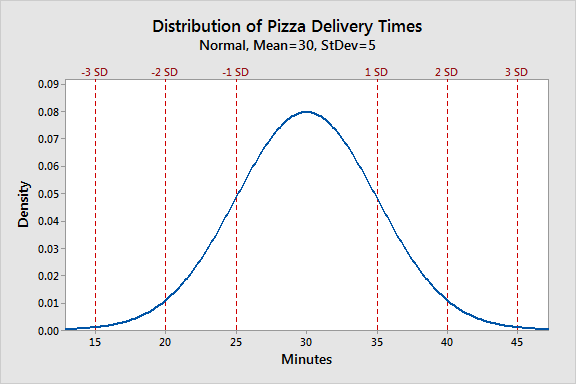
The normal distribution also helps understand standard deviation (how spread out the data is). From this data set, we could say that pizza delivery takes 30 minutes on average (+/- 5 minutes standard deviation). Therefore, the times fall within the 25-35 minute range (1 standard deviation above and below the mean) most of the time.
In technical terms, the normal distribution is a probability distribution that describes how the values of a variable are distributed. The distribution is symmetric, most observations cluster around the mean (the “peak” of the distribution), and values far from the mean are less likely to be observed (the “tails” of the distribution). The normal distribution is useful in statistics because many natural phenomena fit this distribution, such as height.
The distribution of heights is a great example of the naturalness of human variability: some heights are more common and others are less common, but there is no “right” or “wrong” height.
