
Everything You Need To Know About Likert Scales
January 2022
This article is rated as:


Evaluators love a good survey. And why shouldn’t we? They are a cost-effective, quick method for capturing good data! However, not all surveys are awesome – we’ve all come across poorly crafted surveys. Maybe it’s full of double-barreled questions. Maybe the questions are loaded, or leading. Or maybe the response options don’t match how you would choose to respond.
The Likert scale (which, according to Wikipedia, is pronounced LICK-ert; personally, I’ve always said LIE-kert, so I guess I’ll accept being wrong) is one of the more commonly used rating scales in surveys. As evaluators, we should know a thing or two about it, and how to navigate some of the decisions involved in using a Likert scale.
What are Likert Scales?
Likert scales were named after Rensis Likert, a social scientist, who developed the scale as a way to assess a person’s attitudes or feelings. There are many factors that can be assessed using a Likert scale, including (but not limited to):
Level of agreement, satisfaction, concern, acceptability, support, importance, difficulty, and awareness
Frequency
Valence/Quality
Likelihood
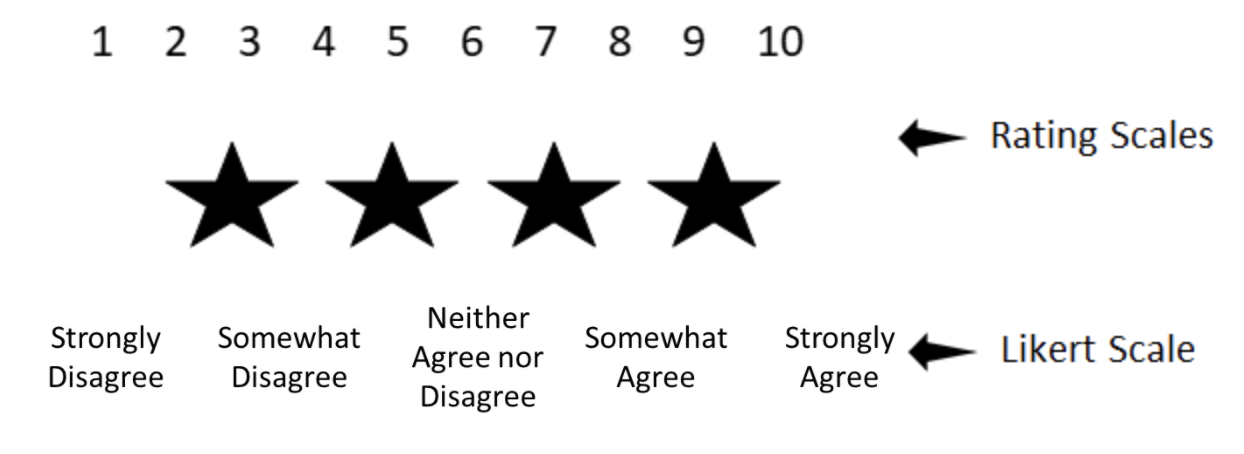
The Likert scale is an important move away from binary-only responses (i.e., yes/no) and helps the evaluator assess a respondent’s feelings or thoughts on a range or spectrum, allowing for a better, more nuanced understanding. Statistically, this offers more variance or discrimination in your data.
Notably, as opposed to rating scales the Likert rating scale uses labels – actual words – for each rating.
Likert scales have some great advantages, including the options to use icons or faces for children or others who may have difficulty reading:

They are also great for formatting into a matrix when you are designing your survey, making it take up less space and easier for the respondent to fill in.

Common Questions about Using the Likert Scale
Like other surveys, a Likert scale survey is still susceptible to the pitfalls of poor survey design: e.g., you still can’t have a double-barreled question. In fact, there are a few additional concerns, or at least conversations, that swirl around the Likert scale:
Do you have to use an odd number of ratings (with a middle point)?
How many anchor points should I use: 3, 4, 5, 6, 7?
How do I report a Likert scale survey?
How do I analyze the data?
Can you combine ratings?
I’ll tell you right now, I don’t have clear answers for any of these 3 questions. But I can help to lay out the arguments for you so that you can make an informed decision.
Does a Likert scale have to have an odd number of choices?
Most Likert scales you come across will have a middle point that offers a neutral selection choice:

Do you have to include this? No. If you don’t, you’ve created what’s called a “forced choice” Likert scale. That is, you’re forcing the respondent to choose a side without the option to be neutral. Many resources advocate for the middle point but if you’re not sure, some questions to ask yourself in consideration include:
Are you working with sensitive subject matter where respondents may be reluctant or feel uncomfortable in a forced choice? (if yes, include the middle point)
Is it possible that neutrality is a valid option? (if yes, include the middle point)
Is there potential that respondents will be reluctant to answer negatively and bias towards a mid-point? (if yes, exclude the middle point)
Sometimes that middle point gives respondents a way to answer quickly without thinking more deeply about their selection, leading to the potential that the collected data are not accurate. Interpretation of the middle point can also be problematic: does it reflect true neutrality or just indifference? Did the respondent not understand the question? Forced choice can offer more declarative data and reporting, but it can also turn off respondents who may genuinely be in that middle ground. Statistically, removing the middle point does not affect the validity or reliability of your data.
Ultimately (and perhaps unfortunately?) it’s up to you. There is no right or wrong choice.
Keep in mind that “not applicable” or “don’t know” are still valid considerations whether or not you have a neutral point. Neutrality and “not applicable” are not the same thing. Consensus is that including a “don’t know” also does not affect the reliability and validity of your data.
Another thing to watch out for is an unbalanced scale. You can remove the middle point, but you shouldn’t offer more choices on one side than the other. In fact, you shouldn’t do this whether the middle point is there or not.

How many anchor points should I use? (and a side conversation about polarity)
Again, there is no right or wrong answer here, but certainly the most common number is 5. In general, the more anchor points you have, the more sensitive your data are and the more variance you have (which is a good thing!). Some research shows that reliability and validity are highest with a 7-point scale when it is bipolar, but unipolar scales are optimized at 5-points.
A side conversation about polarity
Unipolar scales measure the amount of one factor, whereas bipolar scales offer two opposing views:

Unipolar scales can be used wherever there is the possibility of expressing all or none of dimension. Unipolar scales have less need for that middle point discussed above, whereas bipolar scales have a more natural midpoint. Bipolar scales create more cognitive load on the respondent – having to decide which end of the spectrum they align with, and then where on that spectrum they fall. But bipolar scales can be problematic when there is the potential for interpretation about “opposite”. For example, is “dark” the opposite of “light” or perhaps “bright”? Psychometric testing suggests that where possible, a unipolar scale is the better option for improved scale reliability.
Back to the question of how many anchor points: consensus is that anything above 7 doesn’t provide additional variance in your data. So then, what about 3 points? Arguments against using only 3 anchor points is that it provides less discrimination – which is kind of the whole point of using a Likert scale. However, if you are surveying a topic with little expected variance and are hoping for a quick survey option, 3-points can be a valid option.
Another factor to consider is about the method of administration: doing a phone survey and keeping a 7-point scale in your head is likely to be confusing!
How do I report a Likert scale survey?
How to report a Likert scale is as equally an important conversation as creating the scale itself. There is lots of debate swirling around the most appropriate statistical methods to use. This debate centres on the question: can you assume equal distance between the anchor points? That is, are the data ordinal or interval?
Generally, psychometrists seem to agree that a Likert Scale is ordinal (rank) and approximates an interval data set. To analyze Likert scales, many suggest median (or mode) and range (as opposed to mean (or average) and standard deviation). Personally, I’m a big fan of reporting the median in a Likert scale for a few reasons: 1) you don’t have to try to interpret what 3.4 means on a 5-point scale – the median will be a whole number that is found on your scale and 2) it isn’t skewed by outliers. Graphically, Likerts can be depicted in bar charts, or any number of great data viz options.
If you’re looking to do some statistical analysis on a Likert scale survey, the rule of thumb is to use non-parametric tests, which means Spearman’s r for correlations, and Wilcoxon Signed-Rank (in place of the paired t-test) or Mann Whitney (in place of the independent samples t-test). There is debate, however, about whether a Likert approximates interval data well enough to use parametric tests, especially if you are looking at overall questionnaire data (as opposed to a single Likert scale question). Some reports have shown little difference in parametric and non-parametric analyses, so you may be justified in selecting either, particularly if your data follow a normal distribution and you have an adequate sample size. If your data are skewed (as many Likert scales are), best to stick with non-parametric.
Now that we can analyze the data, how do we report it? A personal pet peeve of mine is reports that have data from a 5-point scale and then report it as a 3-point scale, combining the two ends of the scale:

The purpose of a Likert scale is to add discrimination to your data. Combining these scales removes that discrimination. I’m sure you’ve all seen reports that read “x% of respondents either agreed or strongly agreed with the statement.” So, is this ok or not?
Again, the answer is it depends. If you are performing statistical analysis on your tool, absolutely do not combine any of the anchor points – this greatly reduces the value of using the Likert scale to begin with! If, however, you are reporting to a lay audience and are aiming for clear, simple reporting, combining items on a scale can help your audience with interpretation and perhaps make the data more actionable.
Some final tips when drafting or reviewing your scale:
Primacy and recency effects apply to Likert scales, like any other scale. Ideally, you would have two versions of your survey – one where the positive side is on the left and one where it is on the right - and you would distribute these versions randomly to your sample. Some survey platforms can actually do this for you! You’ll need to pay close attention to this when analyzing your data to avoid any mistakes!

As in any survey, there are several respondent biases that come into play, including confirmatory bias and social desirability bias. Good survey design, including allowing for anonymity and clear instruction, can mitigate some of this risk. To avoid confirmatory bias (this is when respondents have a bias toward accepting the statement or agreeing with the question) add variance into your survey (i.e., more anchor points!). You can also try including some question reversals, where the negative statement is used: e.g., “I don’t like the workshop.” This can also help you identify those who are just answering down in a straight line, selecting “agree” down the whole column to get through the survey quickly. Like above, reversals can be tricky in analysis. Communication about reversal statements is required, and likely it’s best to do a double check to ensure the data were analyzed properly.
Pilot test! Though it takes a bit of time and resources, pilot testing any survey (Likert or not) is helpful. You can ask your respondents about any confusing language, measure the amount of time it takes to complete the survey, and assess if the response options reflect the respondents’ desired response.
I’m confident that as an evaluator, Likert scales are part of your toolkit. Hopefully, we’ve shared some relevant tips about how to use and report them effectively.