
Are You Fixing the Wrong Things? How Driver Analysis Reveals Which Survey Items Actually Drive Results

February 2026
About the author: Sheldon Kallio is a Senior Analyst with Three Hive Consulting and a Master’s‑trained quantitative specialist. Since 2016, he has supported dozens of evaluation projects by cleaning, analyzing, and visualizing survey, administrative, and health system data. Sheldon brings deep expertise in transforming complex datasets into clear, accurate insights that strengthen evaluation quality across sectors.
This article is rated as:


Evaluators frequently face a prioritization problem. Survey results come back with multiple items scoring between 3 and 4 out of 5. Leadership reviews the data and asks a reasonable question: “What should we improve first?”
The obvious answer is to focus on whatever scored lowest. Right?
Not necessarily.
Survey scores measure how you are performing, not what actually drives the results. To set effective priorities, you need to know which improvements will have the greatest impact on your outcome – whether that outcome is engagement, satisfaction, program effectiveness, or another key metric. Driver analysis is designed to answer this question. It identifies which factors truly drive the outcome and which have minimal influence, transforming a spreadsheet of scores into clear, evidence-based priorities.
What is a Driver Analysis?
Driver analysis identifies which survey items have the strongest influence on your outcome. In this article, we use staff engagement as our primary example, but the same approach applies to any survey designed to measure both an outcome and contributing factors.
Driver analysis is used with surveys designed to measure a defined outcome. At a minimum, the survey must include:
An outcome question, such as “Overall, I am engaged in my work” for an engagement survey or “Overall, this program was effective in meeting its intended goals” for a program effectiveness survey; and
Potential drivers – survey items that are expected to influence that outcome. For engagement surveys, these may include communication quality, workload, or opportunities for growth. For program effectiveness surveys, drivers might include clarity of program objectives, quality of delivery, or adequacy of resources.
Because driver analysis compares the relative importance of survey items, the outcome and survey questions must be comparable. In practice, this means they should use the same response scale (e.g., a consistent 5-point agreement scale). Mixing response formats – such as combining agreement, frequency, or satisfaction scales – can distort estimates of importance which results in misleading conclusions.
Driver analysis often relies on regression techniques that measure how much each survey item contributes to your outcome when all items are analyzed together. This reveals each item's unique contribution to the outcome rather than mixing the effects of related items.
This distinction matters because survey items often relate to one another. For example, perceptions of manager coaching may be closely linked to learning climate, or mission clarity may overlap with clarity of organizational values. When items are correlated, standard approaches – such as looking only at means or simple correlations – can misrepresent which factors truly drive the outcome.
Driver analysis addresses this by estimating the relative importance of each item while accounting for these inter-relationships. Results are often expressed as percentages showing how much each survey item contributes to explaining variation in the outcome. Higher percentages indicate stronger drivers.
An Example (Using Simulated Data)
Consider a staff engagement survey with 145 responses across 20 survey items: one outcome question and 19 potential drivers, all measured on a five-point Likert scale.
The Traditional Approach: Prioritize by Score
If you look at average survey scores, several low-scoring items appear to be clear priorities for improvement:
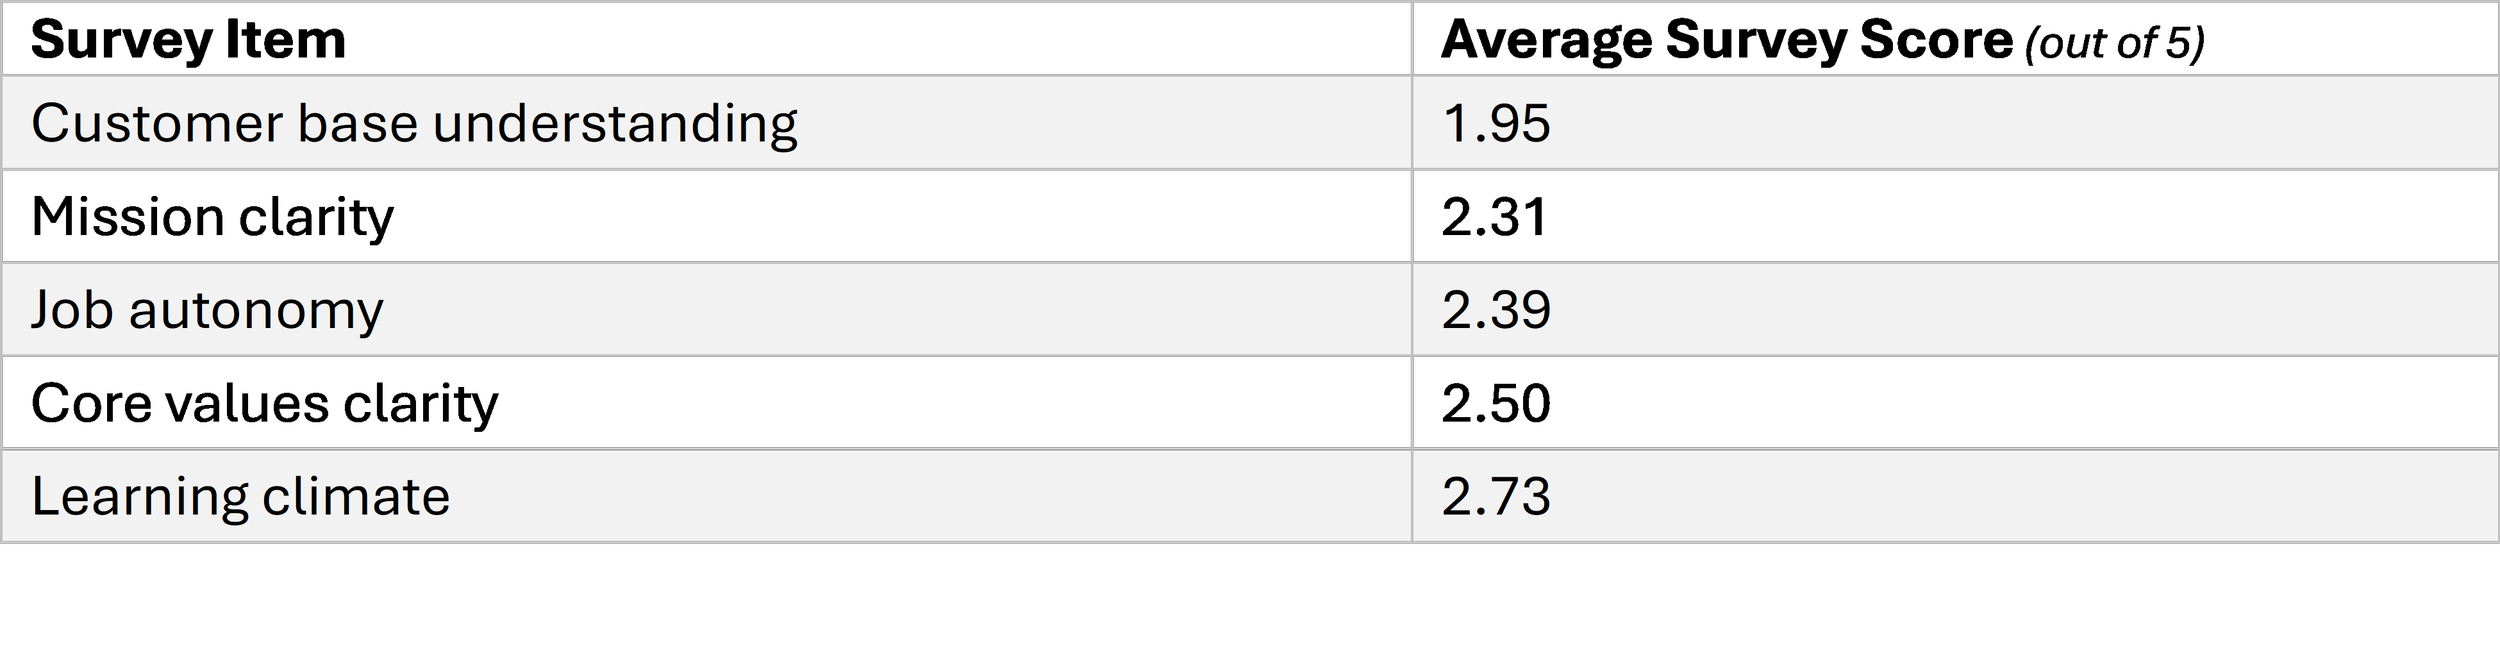
Using this approach, the instinct is to prioritize customer base understanding and mission clarity to improve staff engagement. They scored lowest, so they appear to need the most attention.
But survey scores don’t tell you what drives engagement.
What Changes When You Look at Impact
When we run driver analysis on the same simulated data, we see survey item rankings diverge from impact rankings that the driver analysis generates. Instead of asking “What scored lowest?” (Score), we can now ask “What most strongly predicts overall engagement?” (impact).
The driver analysis results tell a different story:
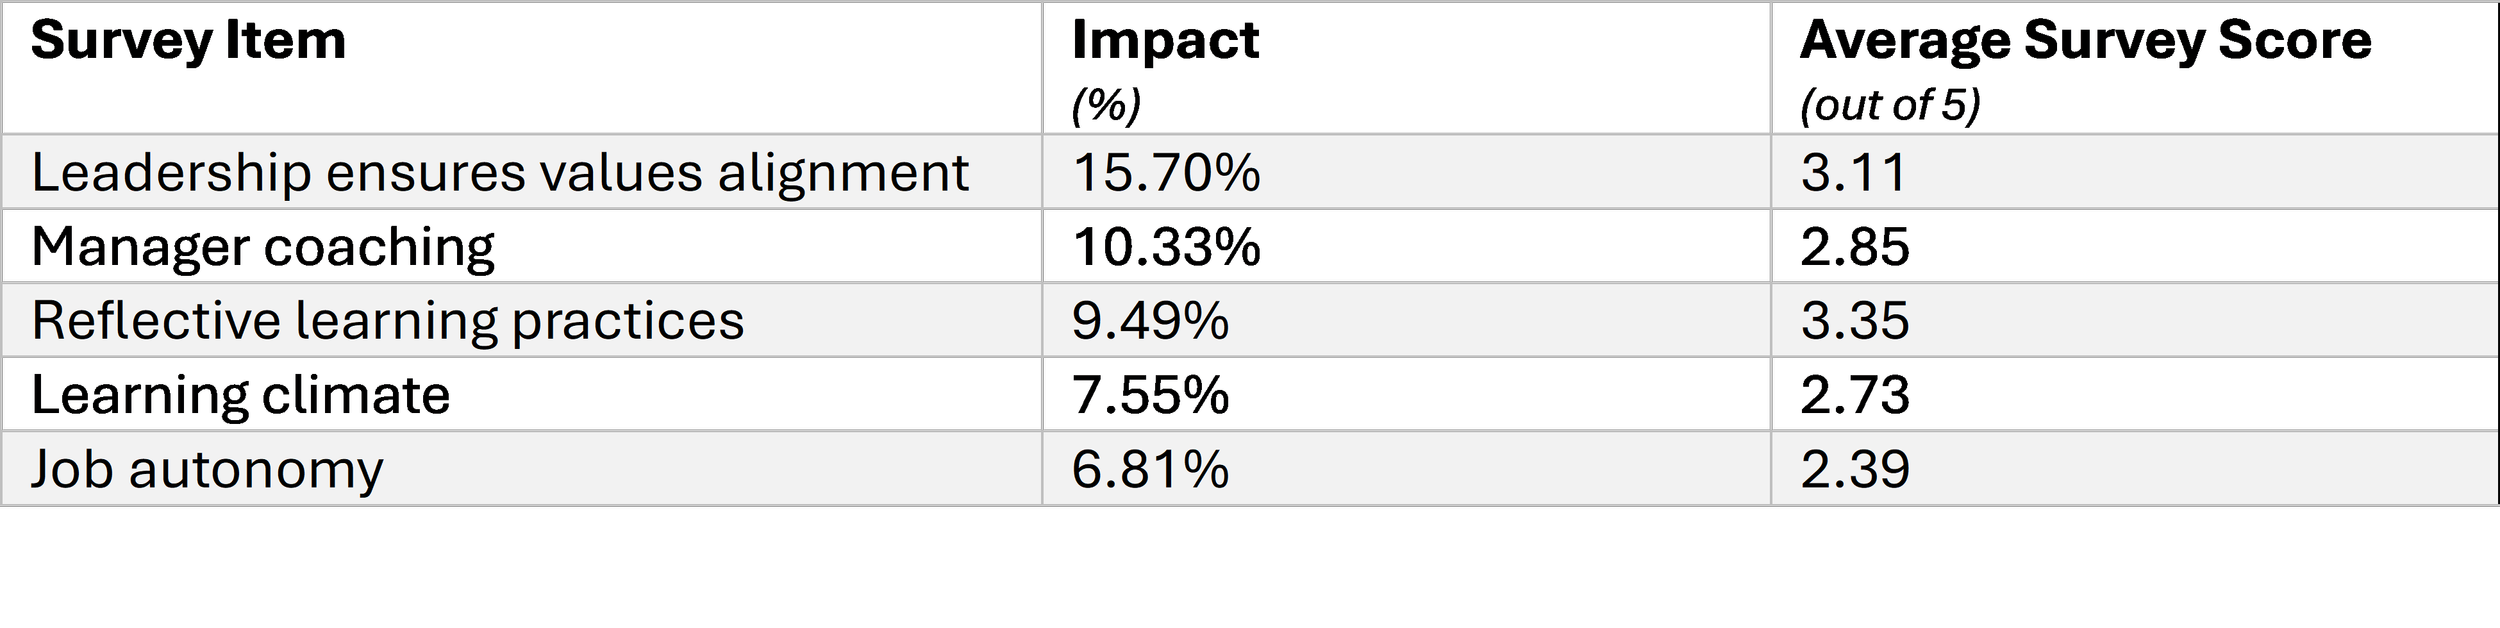
Only one item (job autonomy) appears in both tables. The lowest-scoring items have little influence on engagement, while high-impact drivers like leadership alignment and manager coaching would have been overlooked if priorities were set using survey scores alone.
Low survey scores don’t mean high impact.
Driver analysis reveals which improvements are most likely to increase engagement, helping evaluators move from ranking survey scores to focusing on what actually impacts outcomes.
Why This Matters
It separates score from impact.
A survey item can score poorly but have little impact on engagement. Another item can score moderately but have a large influence on engagement. Scores alone don't tell you where to focus improvement efforts.
In this example, mission clarity scored 2.31 out of 5 but only has 2.57% impact. Job autonomy scored slightly higher at 2.39 but has 6.81% impact (nearly triple). Improving mission clarity will have little effect on engagement, while improving autonomy is likely make a meaningful difference.
It enables prioritization when resources are limited.
Most organizations can’t improve everything at once. Driver analysis identifies which improvements are most likely to create meaningful gains.
Without driver analysis, this organization might focus on the lowest scores. With driver analysis, attention shifts to high-impact items like manager coaching and job autonomy – areas that drive engagement and have room for improvement.
It supports clear, defensible recommendations.
When scores cluster closely, it can be difficult to justify why one item should be prioritized over another. Driver analysis provides a clear rationale for those decisions by distinguishing items that simply score low from those that drive results.
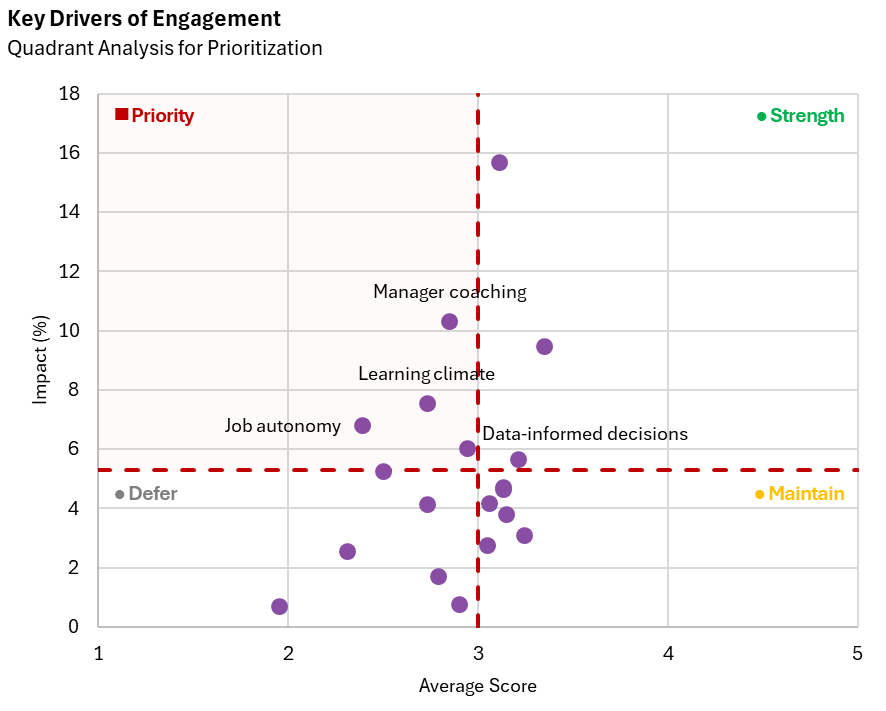
From Insight to Action: The Four-Quadrant Framework
Once impact is understood, the next question becomes practical: which high-impact items should you address first?
Some high-impact items are already performing well. Others are underperforming. The answer requires combining the two dimensions: impact (does this drive engagement?) and score (how are we doing on this?).
Combining impact and score creates a simple four-quadrant prioritization framework:

Focus attention on the Priority quadrant. These items drive engagement and are currently underperforming.
Determining High vs. Low Thresholds
The four-quadrant framework requires deciding on what counts as “high” versus "low” for both impact and score.
For Impact: Take the mean (or median) impact across all survey items. Items above the mean are “high impact” and items below are “low impact”. Impact is relative; what matters is which items drive the outcome most compared to the others.
For score: Your approach depends on how your survey items are performing overall.
If your mean score falls at or above the scale midpoint (e.g., a 3.0 on a 5-point scale): Use the mean (or median) as your dividing line. Items above the mean are “high score”.
If your mean score falls below the scale midpoint: Use the scale midpoint (3.0) as your dividing line. Items scoring >= 3.0 are “high score”. This maintains absolute standards and avoids labelling struggling items as “high scoring items”.
Applying the Framework to Our Example
In our example, we used the mean impact (5.3%) to define high versus low impact. For score, our overall mean was 2.8 – below the scale midpoint of 3.0 – so we used 3.0 as our threshold. This ensures items scoring below neutral aren’t misclassified as high scoring items.
When plotted using this framework, four items fall into the priority quadrant: manager coaching, learning climate, job autonomy, and data-informed decisions. These become your action items.
The framework turns your spreadsheet of numbers into a clear roadmap.
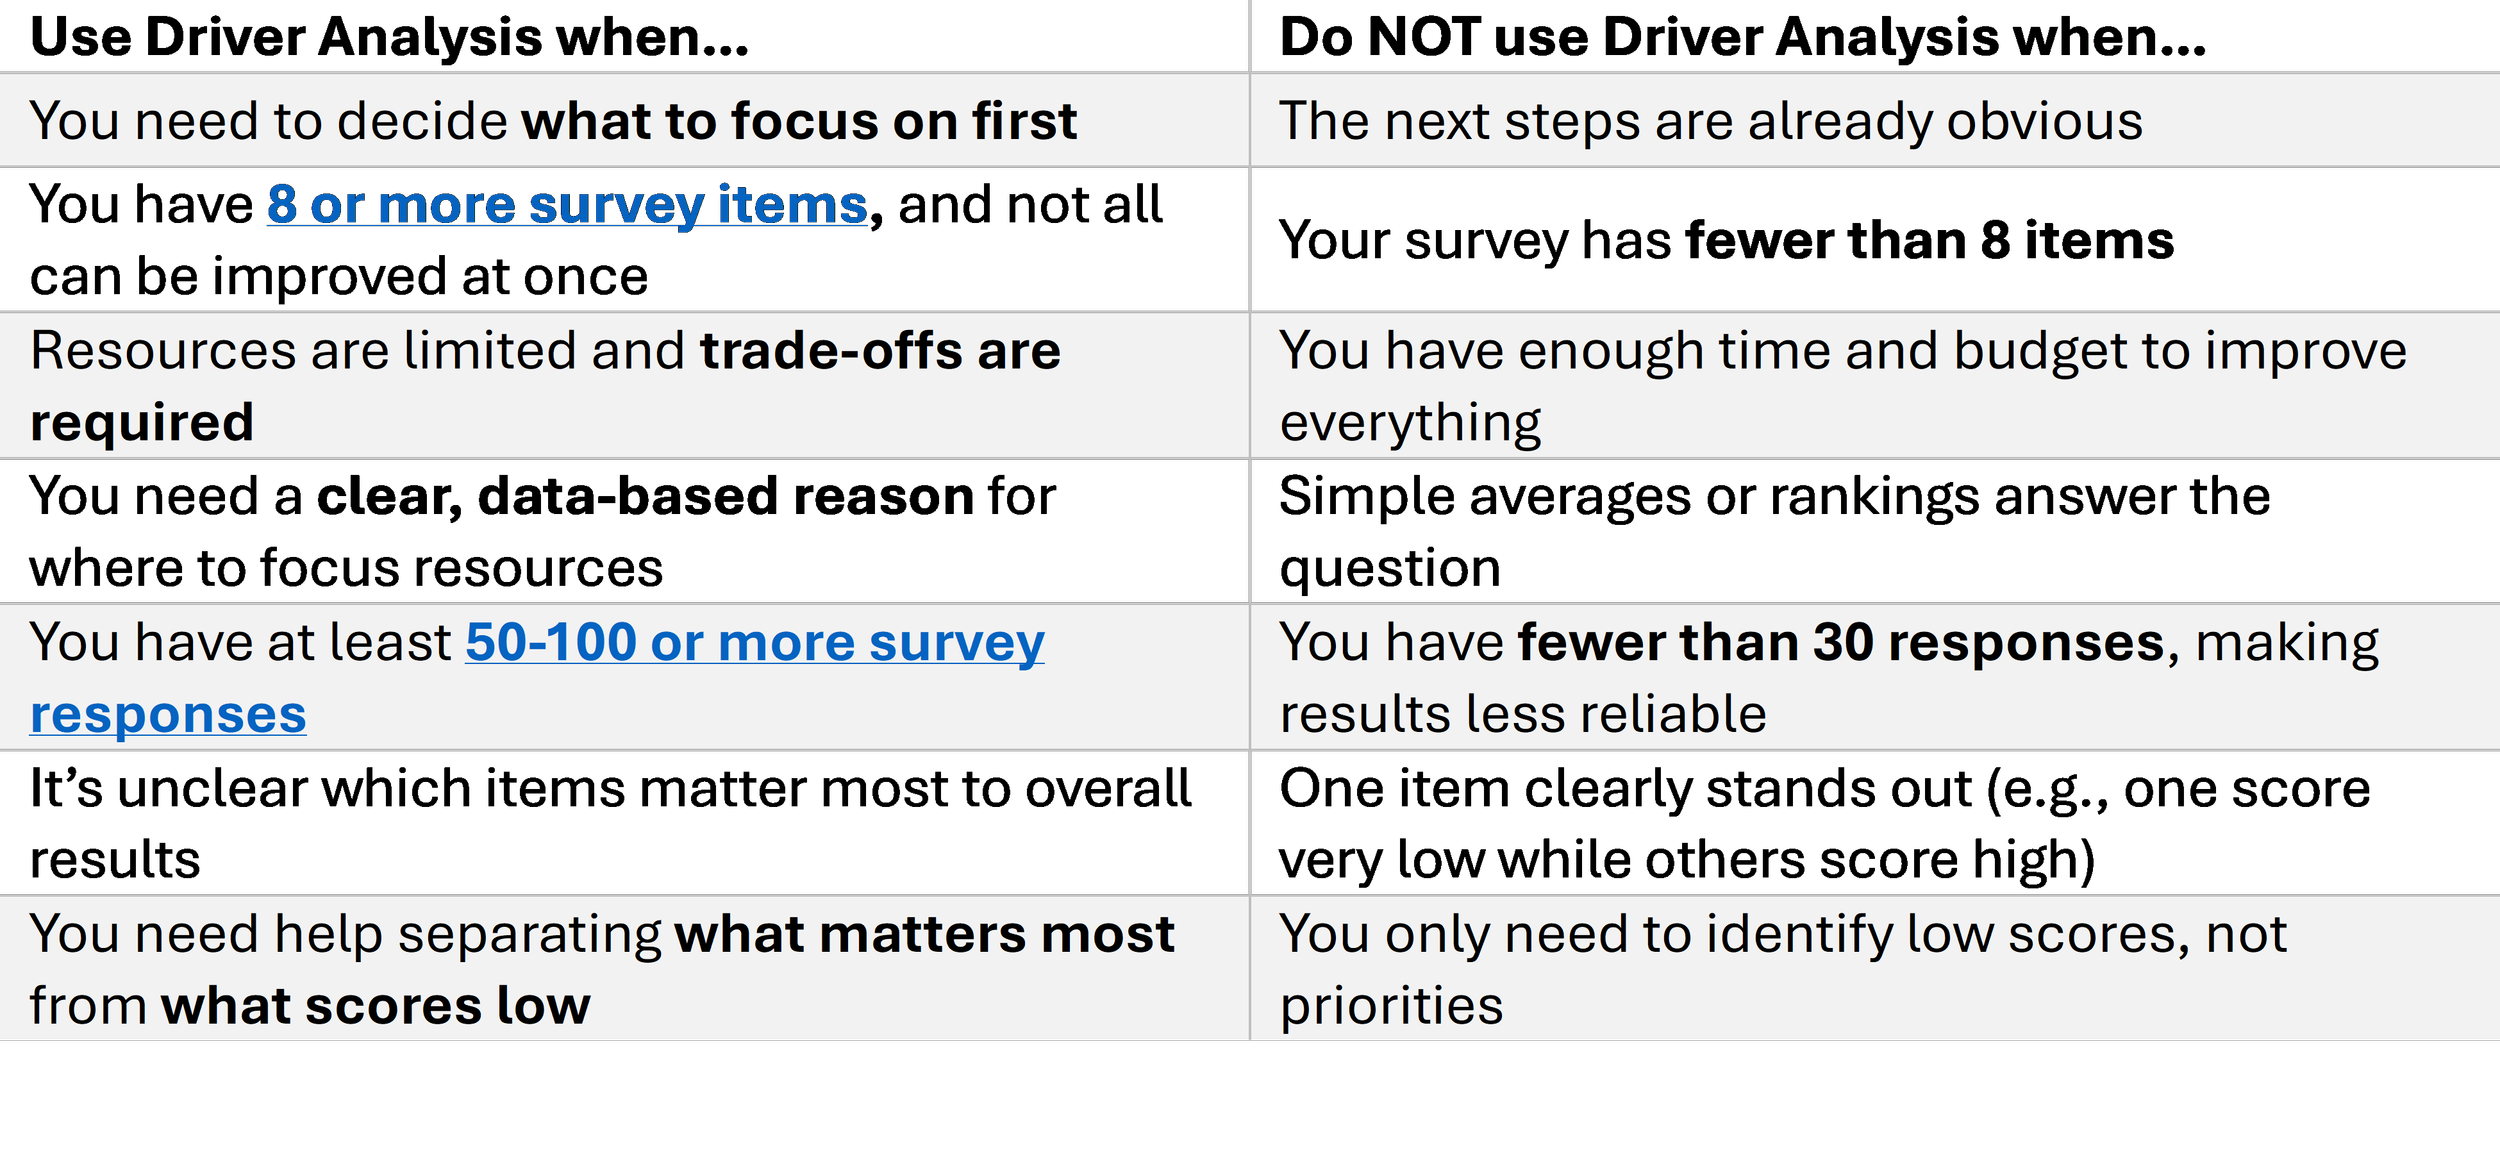
When to Use Driver Analysis
Driver analysis is not necessary for every project, but it can significantly improve prioritization when the conditions are right.
From Analysis to Action
Driver analysis shifts evaluation from reporting survey scores to guiding strategic decisions. It helps evaluators answer the question organizations actually care about: where should we invest limited resources to achieve the greatest impact?
The next time you're staring at survey scores wondering what to prioritize, run a driver analysis. It transforms spreadsheets into clear strategic direction.